How to Track QR Code Scan Data?Updated 40 minutes ago
Overview
Tracking your QR code scans helps you understand customer engagement and measure the success of your marketing efforts. You can easily view lifetime totals for all codes or dive into detailed performance graphs for individual QR codes right from the app.
Step-by-Step Instructions
There are three different ways to view your scan data depending on the level of detail you need:
Option 1: View your top performers on the Dashboard
Open the QuiQR Codes app in your Shopify Admin to access the main dashboard.
Scroll to the Top 5 Most Scanned QR Codes section.
Review the list to see your highest-performing codes alongside the total sum of scans for each.

Option 2: View total scans for all codes
Navigate to the Manage QR Codes screen within the app.
Look at the data table. A dedicated column displays the total scan count for every QR code you have created.
Option 3: View detailed scan graphs over time
Navigate to the Manage QR Codes screen.
Click on the name of any QR code to open its management screen.
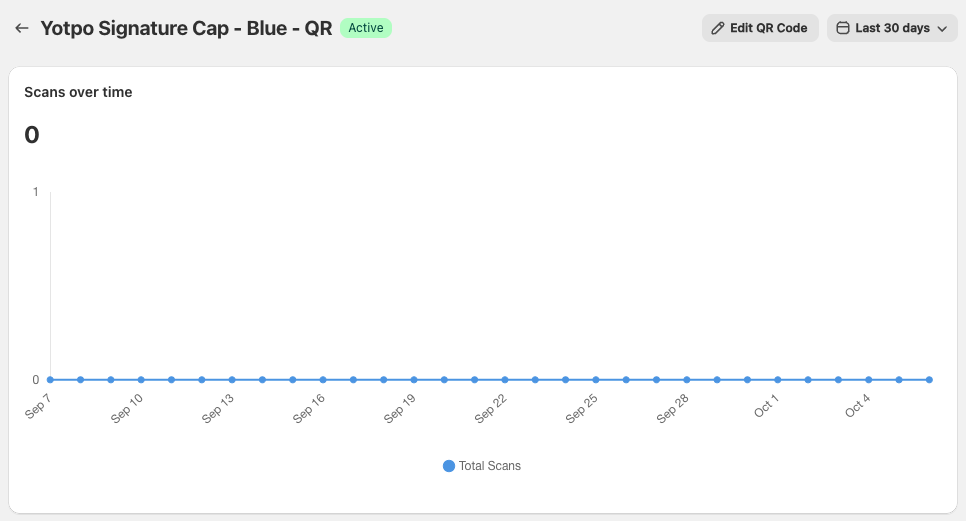
Click the View Performance button. This will open a detailed graph displaying how many times the code was scanned over a period of time.
Click the date filter dropdown to adjust the timeframe. The graph defaults to Last 30 Days, but you can choose from the following options:
Last 7 days
Last 60 days
Last 90 days
Last 6 months
Last 12 months
All time
Verification / Next Steps
Once you are familiar with where to find your performance data, try testing one of your QR codes with your smartphone. Refresh the View Performance page to see your test scan appear on the graph!
TIP
Make it a habit to check your scan data regularly. Comparing the performance of different codes can help you determine which product packaging, mailers, or in-store displays are driving the most traffic to your Online Store.